







Accessible summary
What this session covers
This intermediate session explains how to turn everyday data into a dependable finding. It starts with the question or decision the data should support, then covers reliable structure, formulas, pattern finding, charts, PivotTables and repeatable data preparation.
- defining the question and decision before choosing an Excel feature
- organising workbooks, sheets, headings and data types
- structuring a dataset as an Excel table
- using sort and filter to inspect data
- using formulas for a defined calculation
- using conditional formatting without relying on colour alone
- choosing and simplifying charts
- summarising structured data with a PivotTable
- using Power Query for repeatable cleaning and transformation steps
Making the session work for you
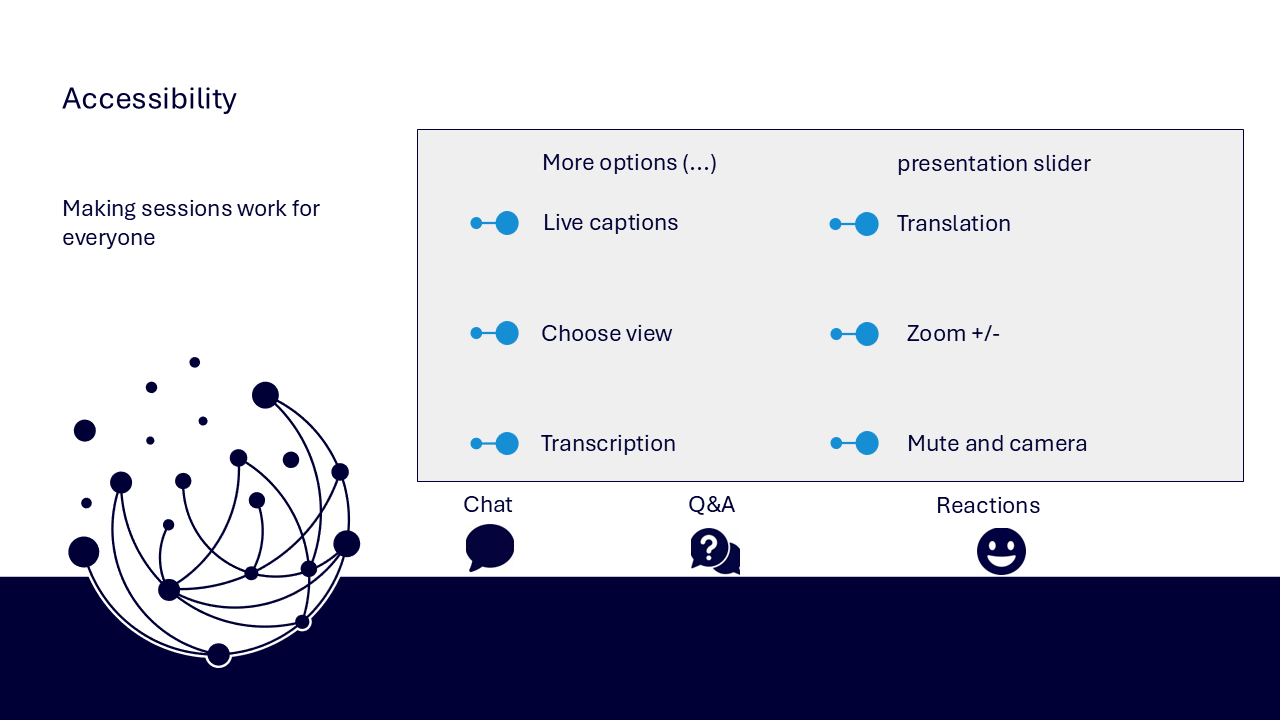
The session is delivered through a Microsoft Teams webinar using PowerPoint Live. You can personalise how you follow and take part. The session is recorded, and you can watch rather than follow along unless the trainer asks you to try something.
- use live captions or translation from the three-dots menu
- choose a view that gives you the clearest layout
- use the presentation slider to zoom in or out
- keep your camera and microphone off unless you are invited to use them
- use Q&A for questions and keep chat closed when you are not typing
- use reactions or another participation route if that works better for you
- share respectful feedback and use the key links provided in chat
Everyone can build confidence
These sessions are for everyone, whatever your starting point. You do not need to remember every formula or feature. The aim is to connect each analytical choice to a clear question and sense-check the result against the visible data.
Navigator and WeChange.AI
Navigator is a personalised platform for WeChange.AI customers. It helps you find Microsoft 365 tools, resources and upcoming sessions relevant to your role.
WeChange.AI supports public and third sector organisations to use technology with confidence, purpose and impact. The focus is practical, people-centred change in day-to-day work.
Key concepts
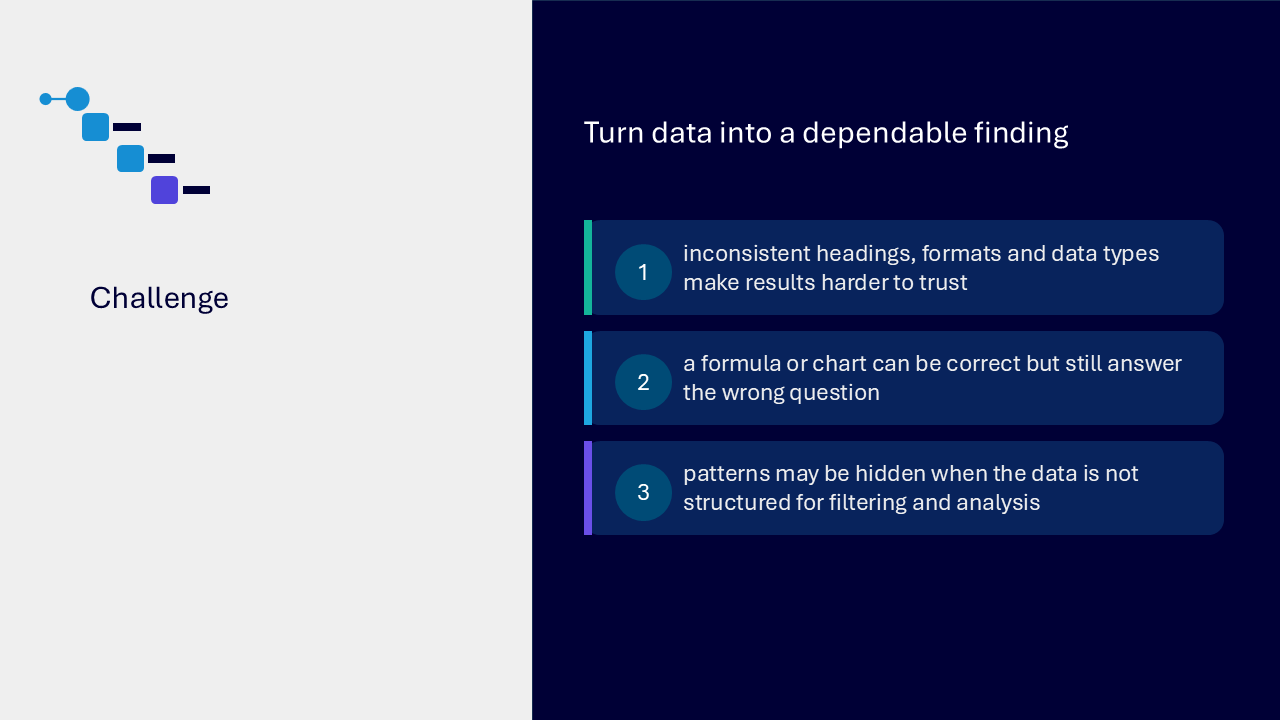
The challenge
The challenge visual identifies three connected risks. Inconsistent headings, formats and data types make results harder to trust. A technically correct formula or chart may still answer the wrong question. Patterns can remain hidden when the data is not structured for filtering and analysis.
Your route through the session
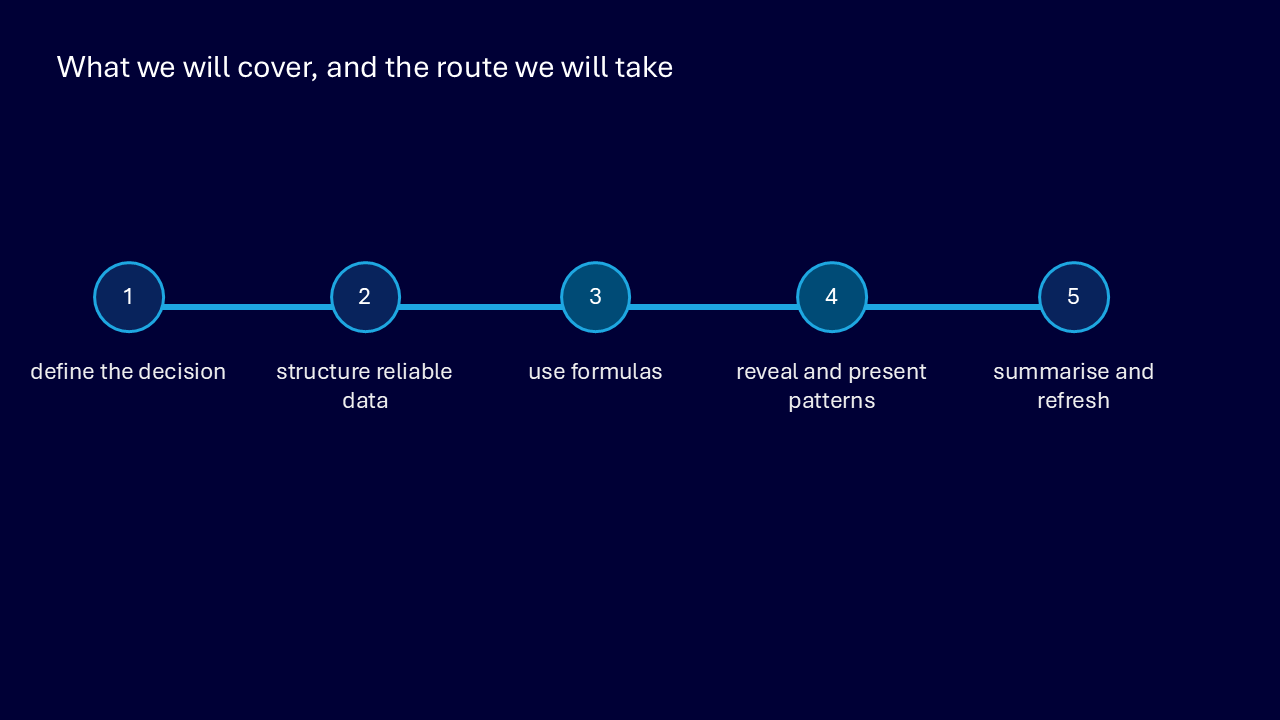
The route graphic presents five stages from question to refreshed summary.
- define the decision
- structure reliable data
- use formulas
- reveal and present patterns
- summarise and refresh
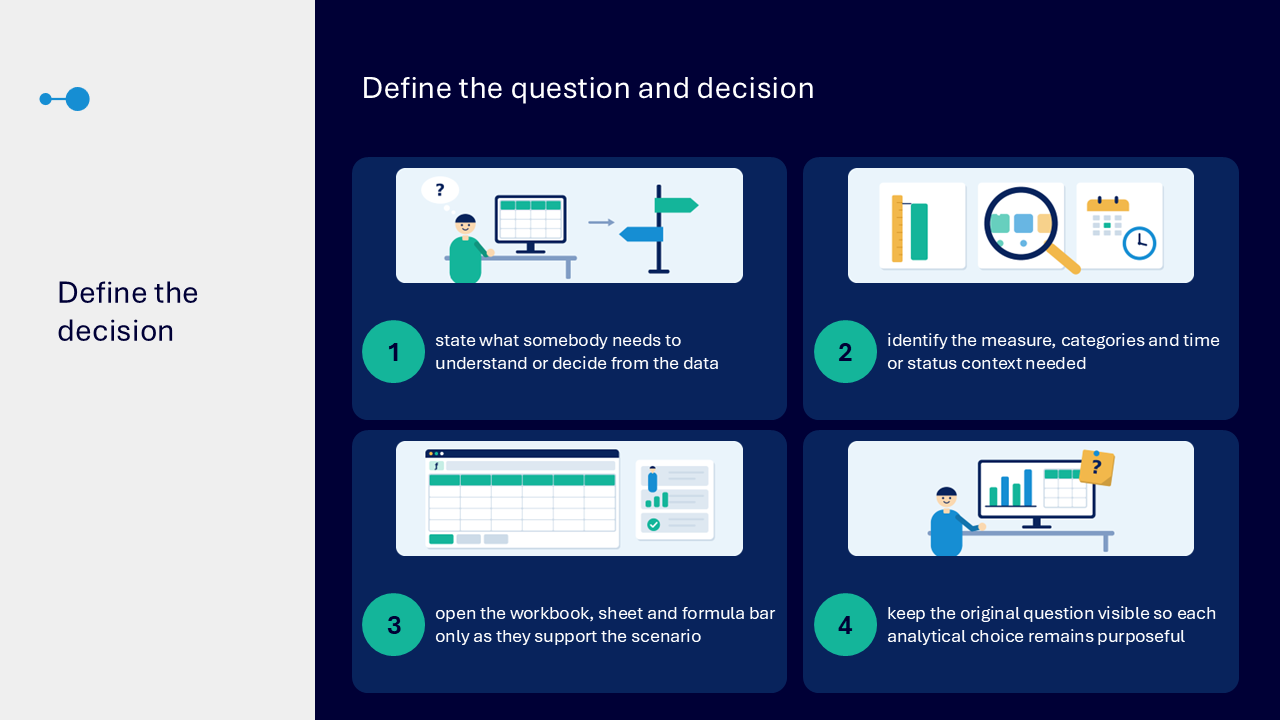
Define the question and decision
Begin by stating what somebody needs to understand or decide. Keep this question visible so each feature, calculation and visual remains purposeful.
- identify the measure, categories and time or status context needed
- open the workbook, sheet and formula bar only as they support the scenario
- name the decision the result should support
- avoid selecting a feature before the question is clear
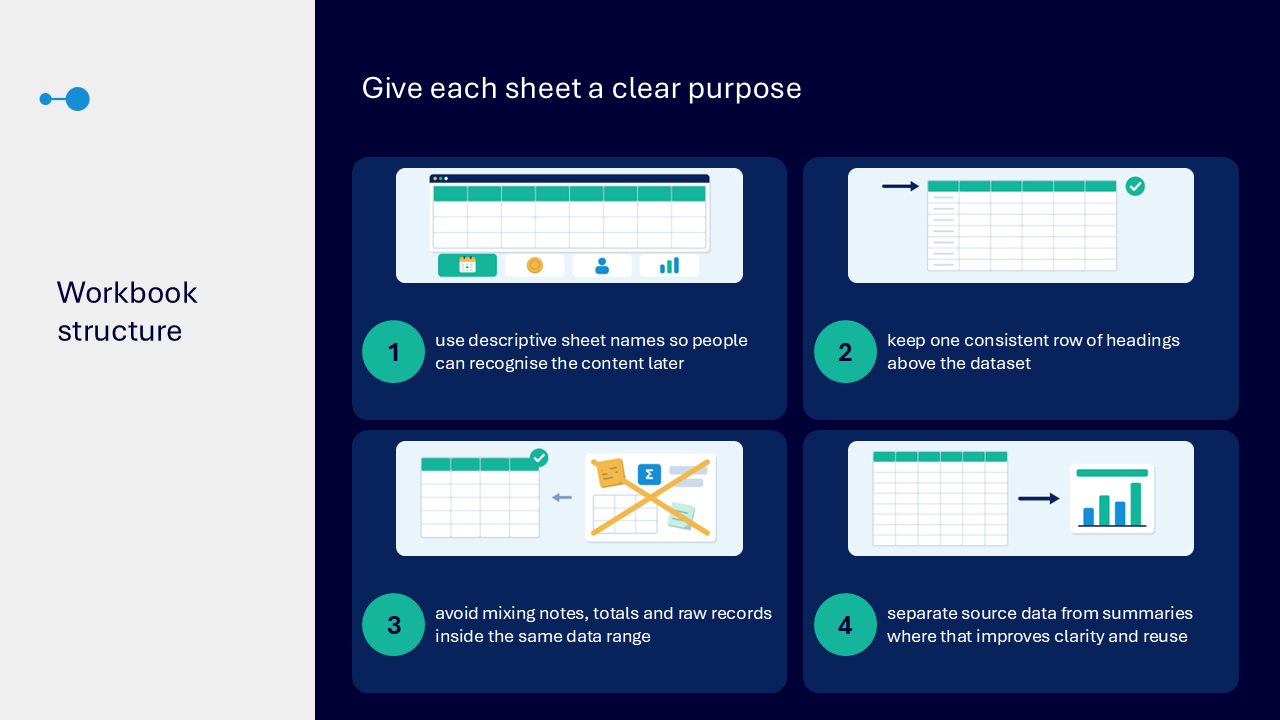
Give each sheet a clear purpose
- use descriptive sheet names so people can recognise the content later
- keep one consistent row of headings above the dataset
- avoid mixing notes, totals and raw records inside the same data range
- separate source data from summaries where that improves clarity and reuse
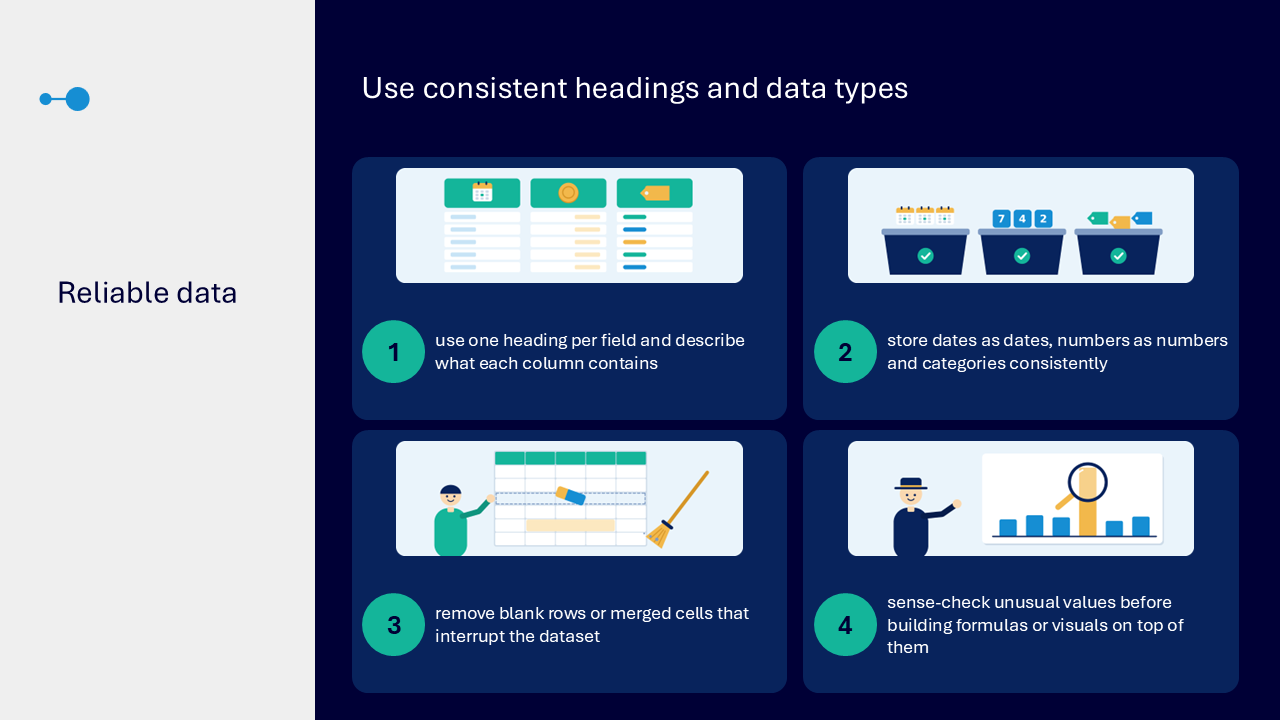
Use consistent headings and data types
Reliable analysis depends on predictable fields and values.
- use one heading per field and describe what each column contains
- store dates as dates, numbers as numbers and categories consistently
- remove blank rows or merged cells that interrupt the dataset
- sense-check unusual values before building formulas or visuals
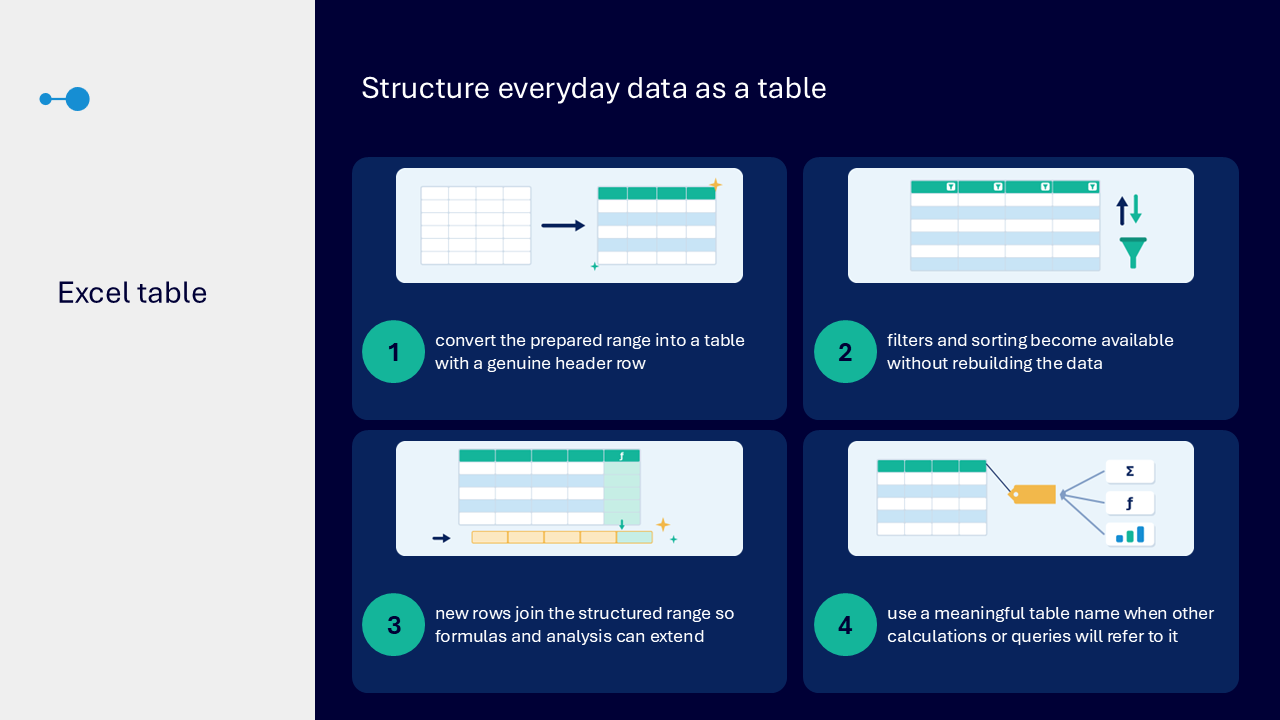
Structure everyday data as an Excel table
An Excel table gives a prepared range a reusable structure with a genuine header row.
- convert the prepared range into a table
- use built-in filters and sorting without rebuilding the data
- allow new rows to join the structured range so formulas and analysis can extend
- use a meaningful table name when calculations or queries will refer to it
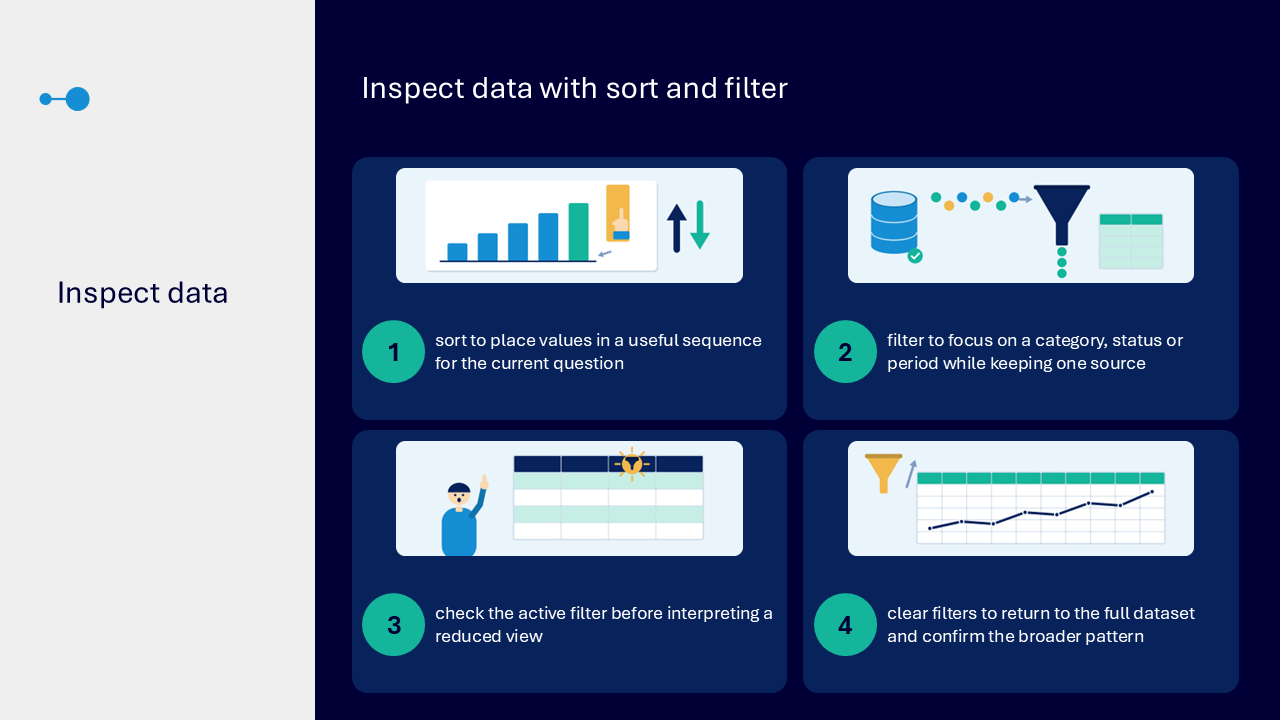
Inspect data with sort and filter
- sort values into a useful sequence for the current question
- filter by a category, status or period while keeping one source
- check the active filter before interpreting a reduced view
- clear filters to return to the full dataset and confirm the broader pattern
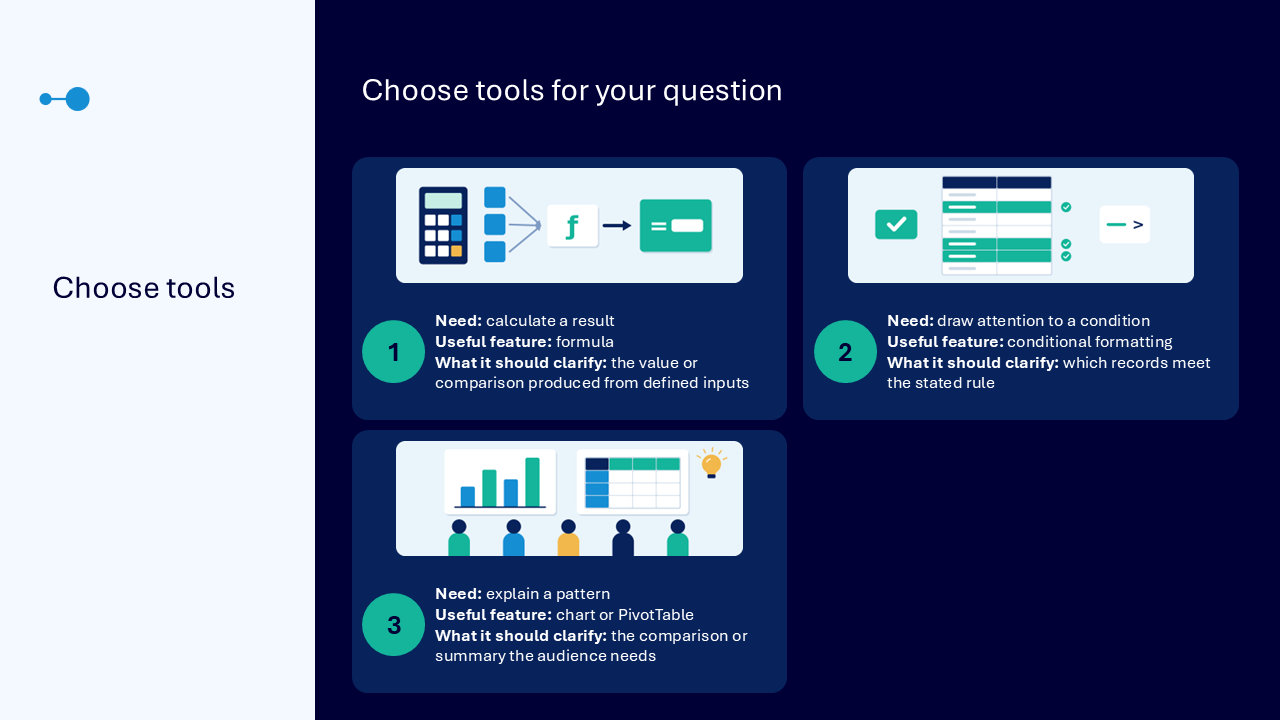
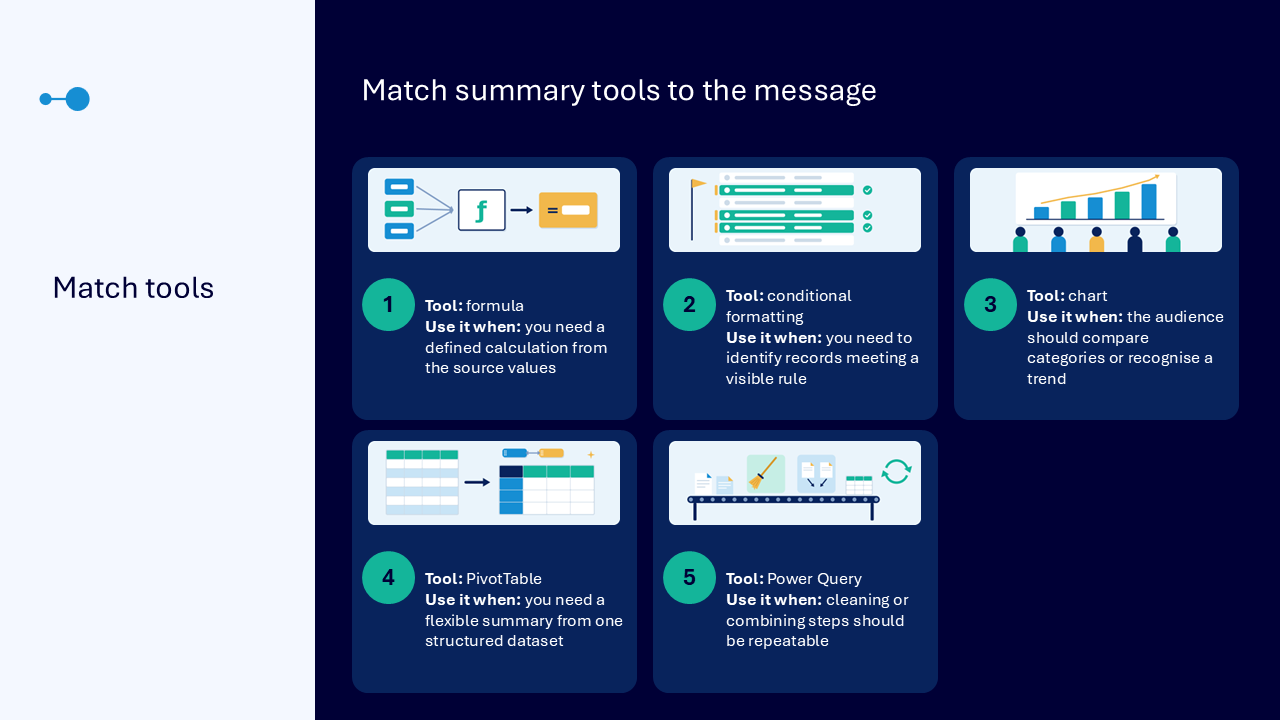
Choose tools for the question
The comparison visual matches each need to the lightest useful feature.
- formula: calculate a value or comparison from defined inputs
- conditional formatting: show which records meet a stated rule
- chart or PivotTable: explain a comparison, pattern or summary needed by the audience
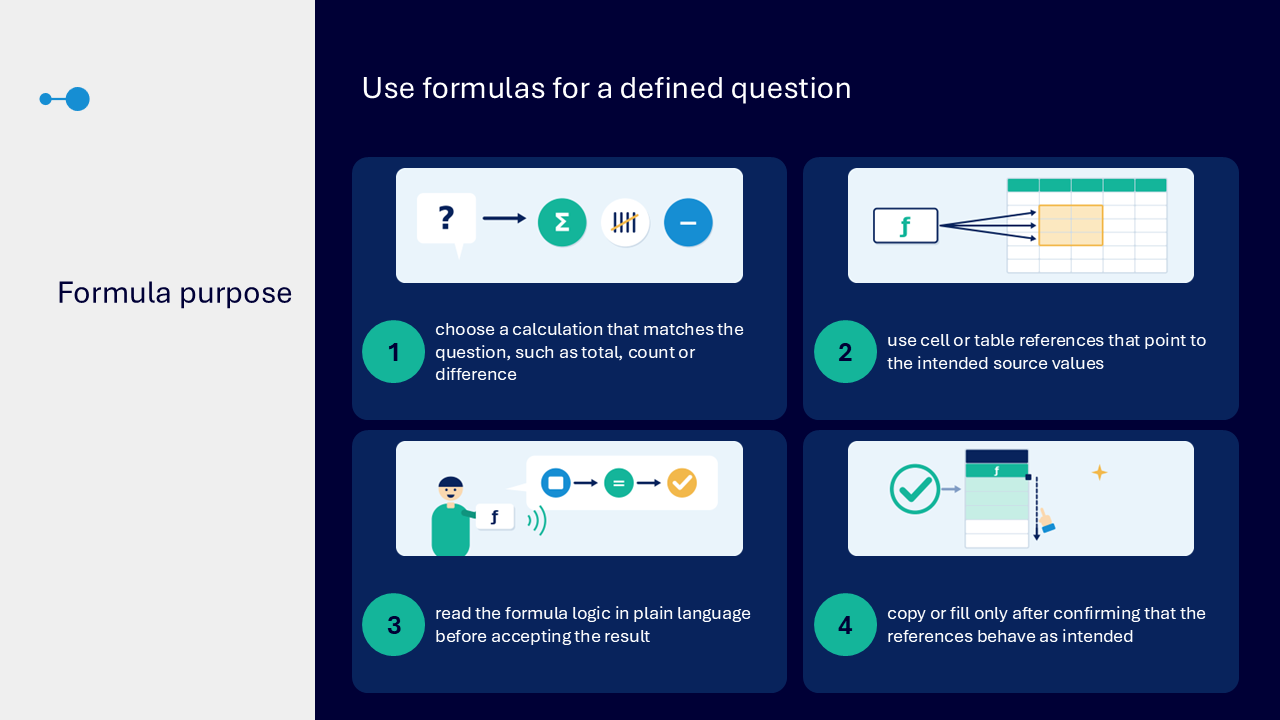
Use formulas for a defined question
- choose a calculation that matches the question, such as a total, count or difference
- use cell or table references that point to the intended source values
- read the formula logic in plain language before accepting the result
- copy or fill only after confirming that the references behave as intended
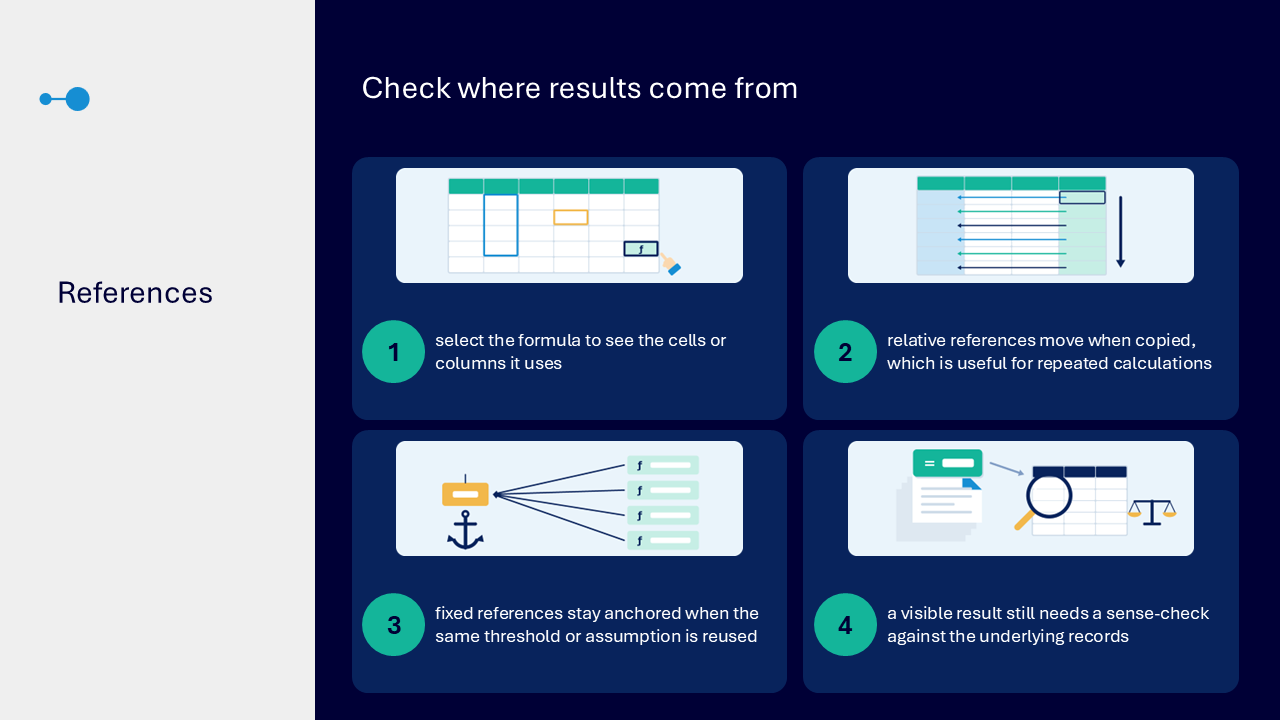
Check where results come from
References show which inputs a formula uses and how those inputs behave when the formula is copied.
- select the formula to see the cells or columns it uses
- use relative references when the reference should move in repeated calculations
- use fixed references when the same threshold or assumption must remain anchored
- sense-check the visible result against the underlying records
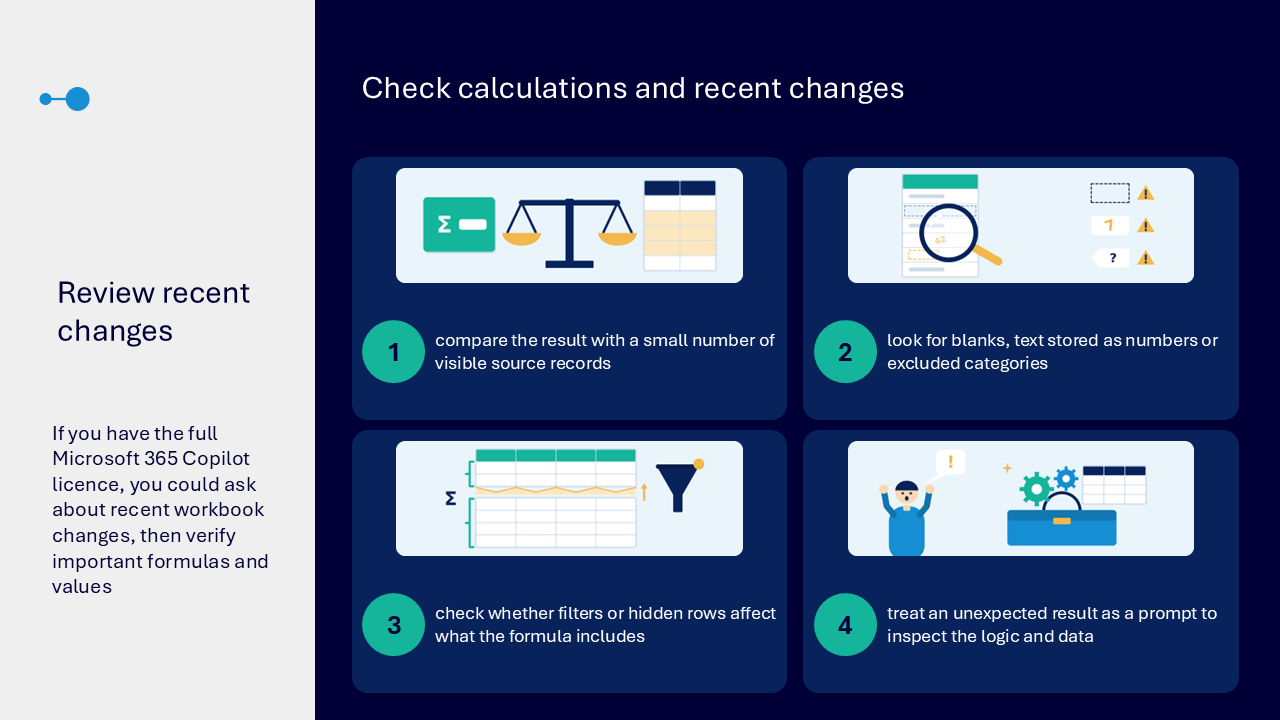
Check calculations and recent changes
- compare the result with a small number of visible source records
- look for blanks, numbers stored as text or excluded categories
- check whether filters or hidden rows affect what the formula includes
- treat an unexpected result as a prompt to inspect the logic and data
If you have the full Microsoft 365 Copilot licence, you may be able to ask about recent workbook changes. Important formulas, references and values still need human verification. Some Basic or Chat access may also be available.
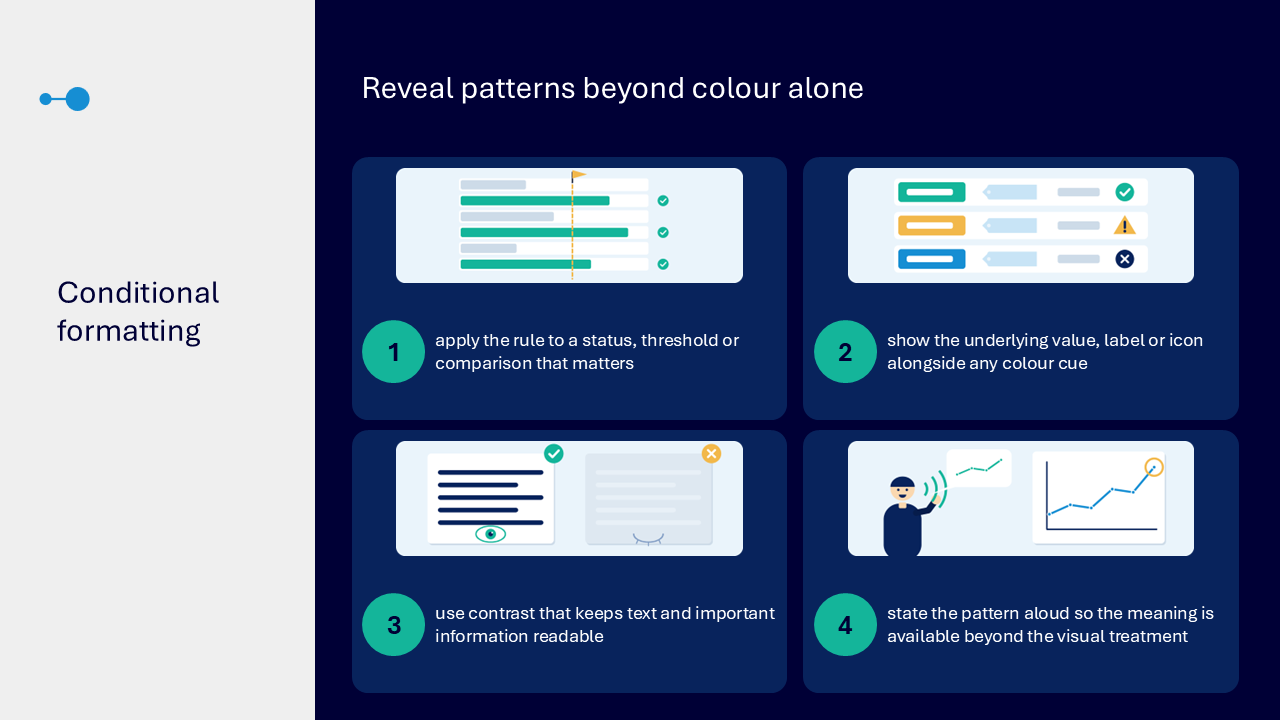
Reveal patterns beyond colour alone
Conditional formatting should highlight a meaningful condition without making colour the only way to understand it.
- apply a rule to a status, threshold or comparison that matters
- show the underlying value, label or icon alongside any colour cue
- use contrast that keeps text and important information readable
- state the pattern in words so the meaning is available beyond the visual treatment
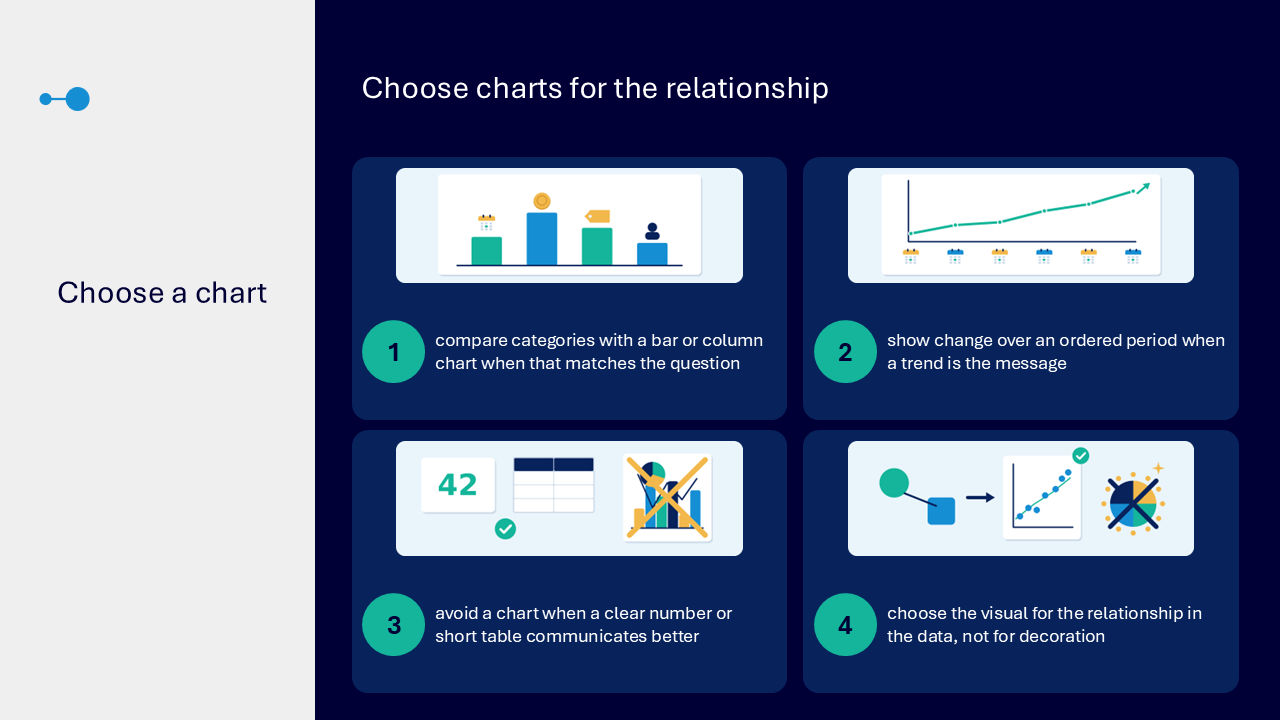
Choose charts for the relationship
- use a bar or column chart to compare categories when that matches the question
- show change over an ordered period when a trend is the message
- avoid a chart when a clear number or short table communicates better
- choose the visual for the relationship in the data rather than for decoration
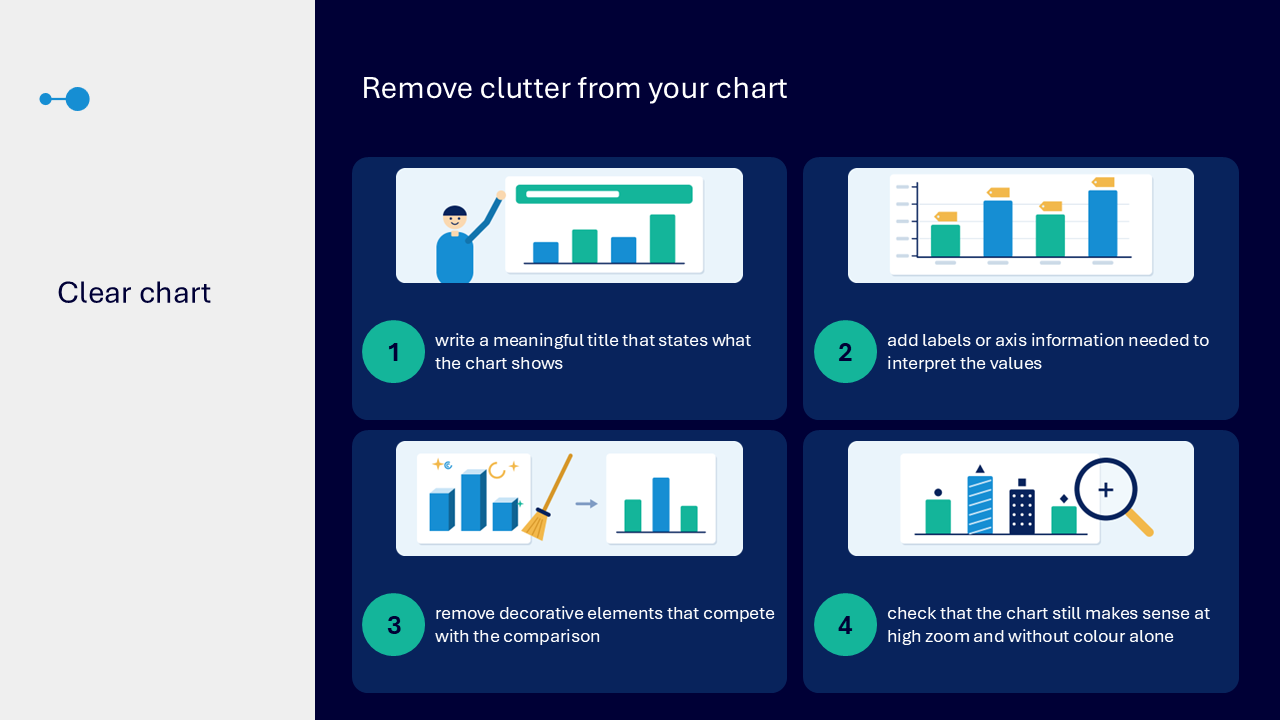
Remove clutter from a chart
- write a meaningful title that states what the chart shows
- add the labels or axis information needed to interpret values
- remove decorative elements that compete with the comparison
- check that the chart still makes sense at high zoom and without colour alone
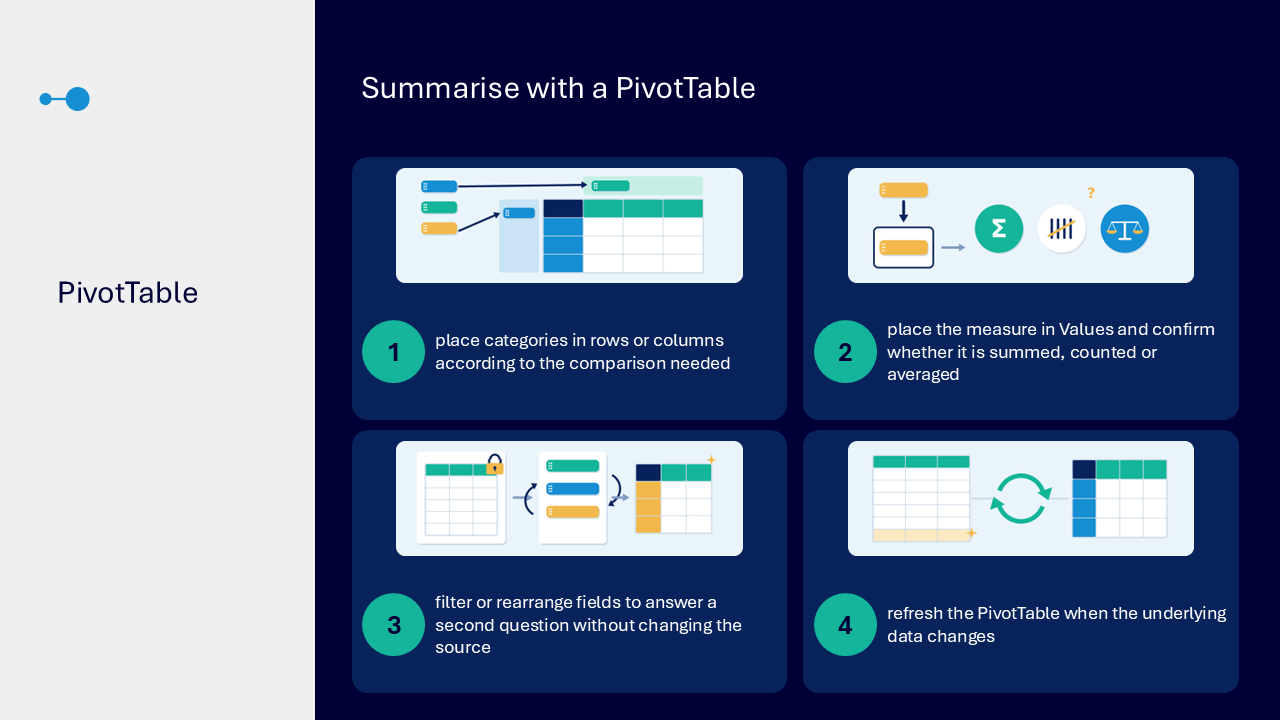
Summarise with a PivotTable
A PivotTable can summarise one structured dataset in different ways without changing the source.
- place categories in rows or columns according to the comparison needed
- place the measure in Values and confirm whether it is summed, counted or averaged
- filter or rearrange fields to answer another question
- refresh the PivotTable when the underlying data changes
Match summary tools to the message
- formula: use for a defined calculation from source values
- conditional formatting: use to identify records meeting a visible rule
- chart: use when the audience should compare categories or recognise a trend
- PivotTable: use for a flexible summary from one structured dataset
- Power Query: use when cleaning or combining steps should be repeatable
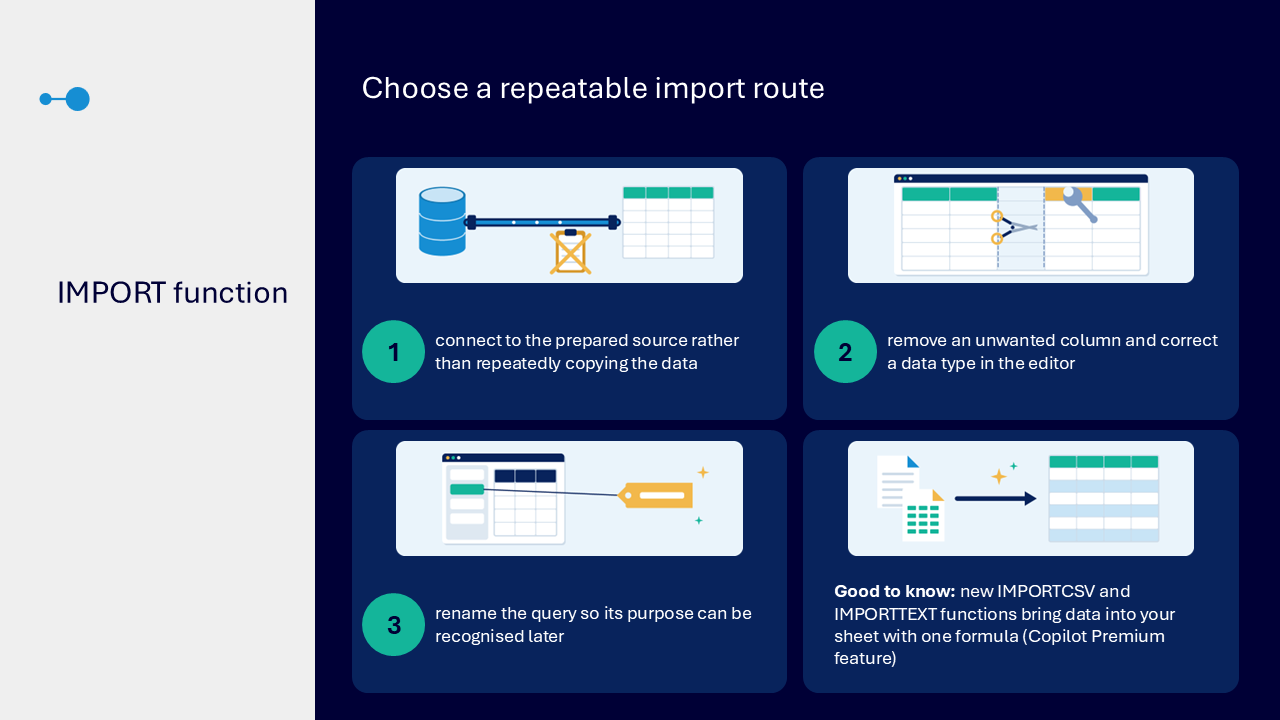
Choose a repeatable import route
The import function offers a repeatable route rather than repeatedly copying data.
- connect to the prepared source
- remove an unwanted column and correct a data type in the editor
- rename the query so its purpose can be recognised later
use Power Query when repeatable cleaning and transformation steps are needed
What the visuals and demonstrations showed
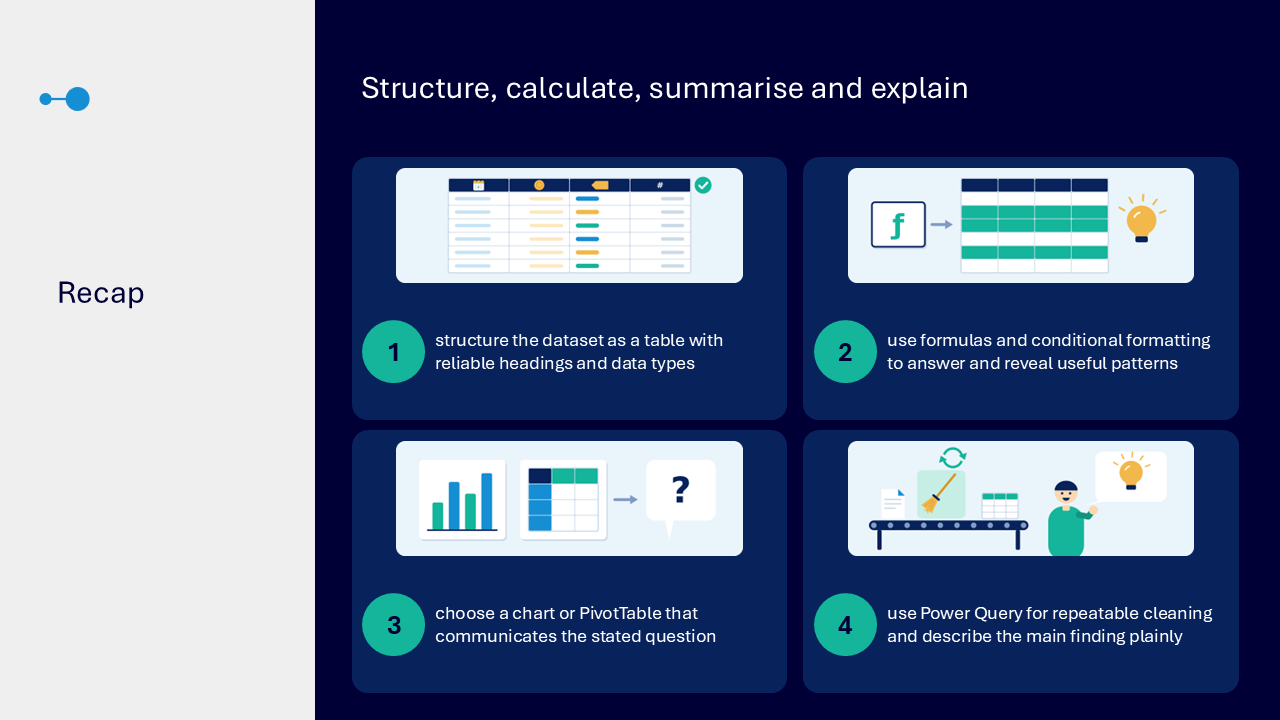
The visual sequence followed the data from a defined question through reliable structure, calculation, pattern finding and a refreshed summary.
- stating a plain-language question before selecting a feature
- giving each sheet a clear purpose
- checking headings, data types and unusual values
- converting a prepared range into an Excel table
- sorting and filtering while checking the active view
- choosing between formulas, conditional formatting, charts and PivotTables
- reading formula logic and checking references
- sense-checking results against visible source records
- using conditional formatting with labels or values as well as colour
- selecting a chart for the relationship and removing clutter
- building and refreshing a PivotTable
- using Power Query for repeatable cleaning steps
- stating the main finding in plain language
Key takeaways
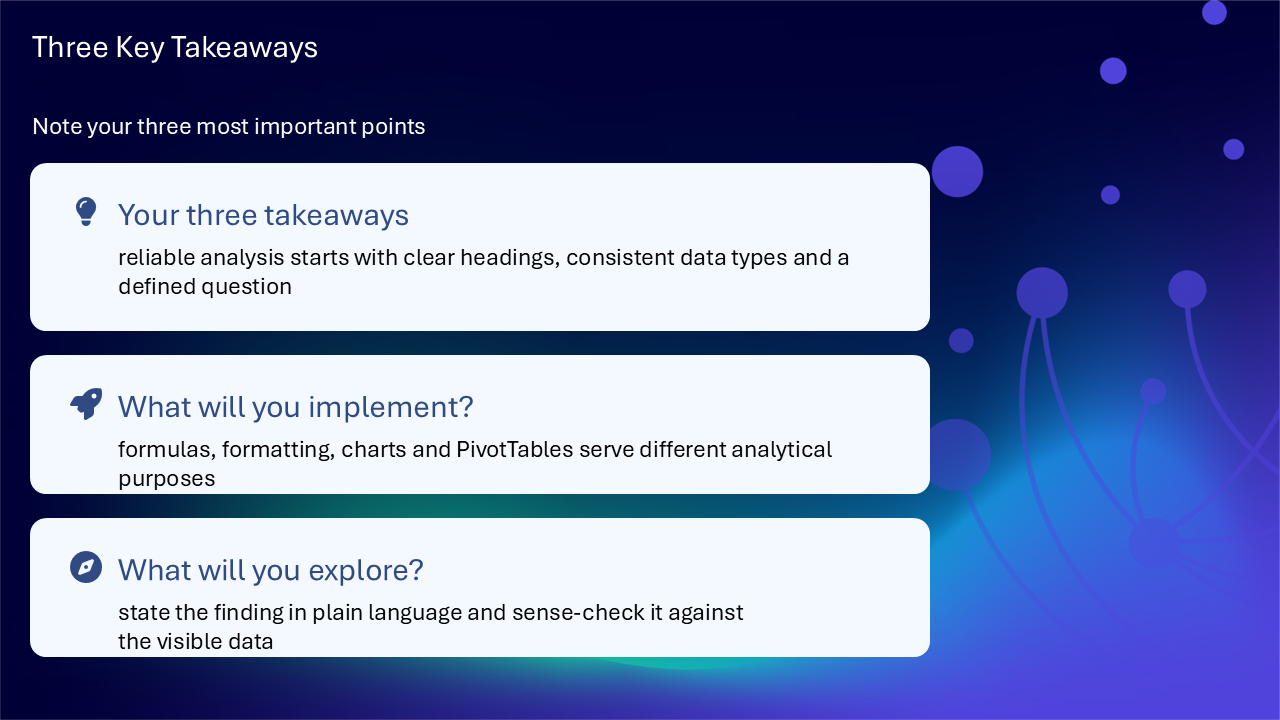
- reliable analysis starts with clear headings, consistent data types and a defined question
- formulas, conditional formatting, charts and PivotTables serve different purposes
- a visible result still needs to be checked against the underlying data
- a chart should communicate the relationship more clearly than the table alone
- Power Query supports repeatable cleaning and transformation steps
- state the finding in plain language and sense-check it
A clear route from data to finding
- state the question and decision
- structure the data with reliable headings and types
- use the lightest feature that answers the question
- check formulas and references against source records
- present patterns without relying on colour alone
- summarise and refresh when the source changes
- explain the finding in plain language
Actions you can take
Try the tip of the month
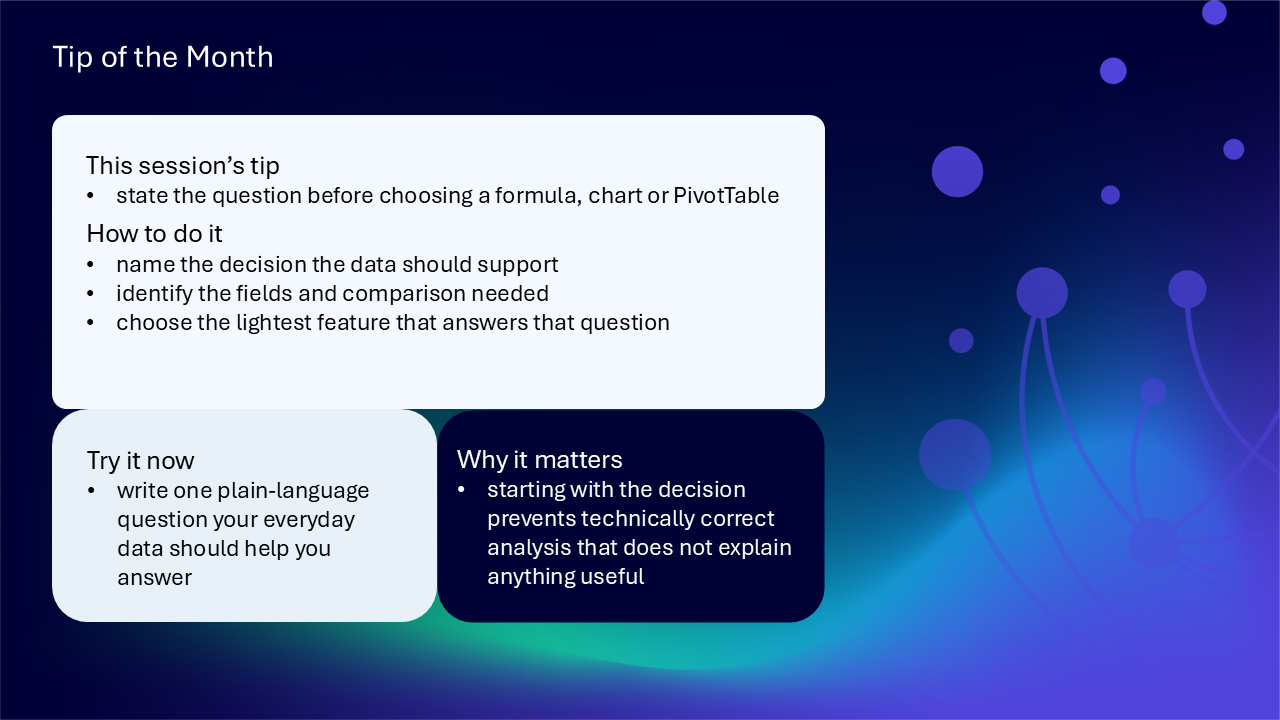
This session’s tip: state the question before choosing a formula, chart or PivotTable
How to do it: name the decision the data should support, identify the fields and comparison needed, then choose the lightest feature that answers the question
Why it matters: starting with the decision prevents technically correct analysis that does not explain anything useful
Try it now: write one plain-language question your everyday data should help you answer
Build confidence with one practical route
- choose one everyday dataset and state the question it should answer
- check that each column has one clear heading
- check that dates, numbers and categories use consistent data types
- remove blank rows or merged cells that interrupt the range
- convert the prepared range into an Excel table
- use sort or filter to inspect one relevant category or period
- choose one formula, formatting rule, chart or PivotTable that fits the question
- sense-check the result against visible source records
- write the main finding in one plain-language sentence
Questions and feedback
Questions are welcome. If something is unclear, ask for it to be explained another way or demonstrated again. Feedback helps WeChange.AI understand what matters to you.
Complete the Support and Skilling Week feedback form
Contact WeChange.AI
For skilling queries, email training@wechange.ai.
Andrew Boxall, Managing Director: andrew@wechange.ai
Paul Ford, Industry Director for Education and Philanthropies: paul@wechange.ai
Josh Wilson, Industry Specialist: josh@wechange.ai
Elle Avilla, Customer Success and Delivery Skilling Lead: elle@wechange.ai
Izzy Pochin, Resources and Accessibility Lead: izzy@wechange.ai
Activity sheet
Follow one connected route from defining the question through to structuring, calculating, summarising and explaining a dependable finding.
How to use this activity sheet
This sheet supports Session 10: Microsoft Excel. Use it after the live session, or follow selected steps while your trainer demonstrates tables, formulas, filters, conditional formatting, charts, PivotTables and repeatable data preparation.
- work at your own pace and pause after each activity
- use a new practice workbook or non-sensitive example data
- save a separate practice copy before changing important information
- your screen may differ between Excel on the web and the desktop application
- check visible values and formula logic before relying on a result
What you will achieve
- state the question and decision before choosing an Excel feature
- give each worksheet a clear purpose
- use consistent headings, data types and one record per row
- convert a prepared range into an Excel table
- sort and filter without losing sight of the full dataset
- use a formula for a defined question and check its references
- use conditional formatting without relying on colour alone
- choose and simplify a chart for the relationship in the data
- build and refresh a PivotTable summary
- recognise when Power Query supports repeatable cleaning
- state the finding in plain language and sense-check it against the source data
Your learning route
| Stage | You will practise |
|---|---|
| 1. Define the decision | question, audience, measure and comparison |
| 2. Structure reliable data | sheets, headings, data types and tables |
| 3. Inspect the records | sort, filter and unusual values |
| 4. Calculate | formulas and references |
| 5. Reveal patterns | conditional formatting and accessible cues |
| 6. Present | clear charts and plain-language findings |
| 7. Summarise | PivotTables and refresh |
| 8. Prepare repeatably | Power Query and reusable steps |
Before you start
- open Excel and create a blank practice workbook
- save it with a clear practice filename
- prepare a small dataset with at least five rows and fields for category, date, status and value
- avoid personal, confidential or sensitive information
- allow about 60 minutes, or complete one activity at a time
Notice: Some analytical and data-preparation features vary between Excel on the web, desktop Excel, licences and organisational settings. Use only the features available and authorised in your environment.
Activity 1: Define the question and decision
Outcome: State what somebody needs to understand or decide before choosing a formula, chart or PivotTable.
- Name the intended reader or decision-maker.
- Write one plain-language question the data should answer.
- Identify the measure, such as value, count or difference.
- Identify the category, time period or status needed for comparison.
- Keep the question visible while completing the remaining activities.
| Planning question | Your answer |
|---|---|
| Who needs the finding? | |
| What should they understand or decide? | |
| What measure is needed? | |
| What categories or periods must be compared? | |
| What would count as a useful answer? |
Pause and check
Activity 2: Give the workbook and sheets a clear purpose
Outcome: Organise the workbook so source data and summaries are recognisable and reusable.
- Rename the first worksheet for the source data.
- Add a second sheet for a summary or chart if the scenario needs one.
- Keep one consistent heading row above the source records.
- Move notes and totals outside the raw data range.
- Check that each sheet has one clear purpose.
| Sheet | Purpose | Content that belongs there |
|---|---|---|
| source data | ||
| summary or analysis | ||
| reference or notes, if needed |
Pause and check
Activity 3: Create reliable data
Outcome: Use consistent headings, data types and records that can support dependable analysis.
- Use one heading for each field.
- Check that every row represents one record.
- Store dates as dates and numbers as numbers.
- Use consistent wording for categories and status values.
- Remove blank rows and merged cells that interrupt the range.
- Inspect unusual or missing values before building analysis.
| Field | Expected data type | Consistency check |
|---|---|---|
| category | text | same wording for the same category |
| date | date | recognised as dates, not text |
| status | text | agreed values used consistently |
| value | number | numbers stored as numbers |
An unusual value I checked: ____________________________________________________________________
The action I took: ____________________________________________________________________
Pause and check
Activity 4: Structure the data as an Excel table
Outcome: Convert the prepared range into a reusable structure with genuine headings, sorting and filtering.
- Select one cell inside the prepared data range.
- Choose the command to create a table.
- Confirm that the range is correct and that the table has headers.
- Choose a table style with readable contrast.
- Give the table a meaningful name.
- Add one new practice row and check that it joins the table.
The table name: ____________________________________________________________________
How I confirmed the new row joined: ____________________________________________________________________
Notice: An Excel table helps formulas, filters and analysis extend with the structured range. It does not correct inconsistent values automatically.
Pause and check
Activity 5: Inspect data with sort and filter
Outcome: Focus on a category, status or period while keeping one source dataset.
- Sort one field into a useful sequence for the question.
- Apply a filter to one category, status or period.
- Check which filter indicator is active.
- Count or inspect the visible records without assuming hidden records are absent from the source.
- Clear the filter and return to the full dataset.
- Compare the reduced view with the broader pattern.
| Inspection step | Your note |
|---|---|
| field sorted | |
| filter applied | |
| pattern in the reduced view | |
| pattern after clearing the filter |
Pause and check
Activity 6: Use a formula for a defined question
Outcome: Create a calculation that matches the question and verify where the result comes from.
- Choose a calculation that matches the question, such as total, count or difference.
- Select the source cells or structured table column intentionally.
- Enter the formula.
- Read the formula logic in plain language.
- Compare the result with a small number of visible source records or a simple independent check.
- Copy or fill the formula only after confirming how its references behave.
| Formula check | Your note |
|---|---|
| question answered | |
| formula used | |
| source cells or columns | |
| plain-language logic | |
| sense-check performed |
Notice: Relative references normally move when copied. Fixed references remain anchored. Check the behaviour before copying a formula across rows or columns.
Pause and check
Activity 7: Review an unexpected result
Outcome: Treat an unexpected result as a prompt to inspect both the data and the logic.
- Select the formula and review the highlighted source cells or columns.
- Look for blanks, categories excluded by spelling differences, or numbers stored as text.
- Check whether filters or hidden rows affect what you are viewing.
- Check whether copied references moved as intended.
- Correct the source or formula only when you understand the cause.
- Repeat the sense-check.
| Possible cause | Checked | Finding |
|---|---|---|
| blank or missing values | ||
| number stored as text | ||
| inconsistent category | ||
| active filter or hidden row | ||
| incorrect reference |
Pause and check
Activity 8: Reveal a pattern beyond colour alone
Outcome: Apply conditional formatting to a meaningful rule while keeping the result understandable without colour.
- Choose a status, threshold or comparison that matters to the question.
- Select the relevant table field or cell range.
- Apply a conditional formatting rule.
- Keep the underlying value or label visible.
- Check that text and important information retain sufficient contrast.
- Explain the pattern in one sentence without referring only to colour.
- Remove the practice rule if it does not improve understanding.
The rule: ____________________________________________________________________
The visible value or label: ____________________________________________________________________
The pattern in plain language: ____________________________________________________________________
Pause and check
Activity 9: Choose and simplify a chart
Outcome: Use a chart only when it explains the comparison or trend more quickly than the table alone.
| Relationship | Possible choice |
|---|---|
| compare categories | bar or column chart |
| show change across an ordered period | a trend chart that preserves the order |
| communicate one clear value | a number or short table may be clearer |
- Select only the data needed for the question.
- Choose a chart that matches the relationship.
- Write a meaningful title that states what the chart shows.
- Add only the labels or axis information needed to interpret values.
- Remove decorative elements that compete with the comparison.
- Check the chart at high zoom and without relying on colour alone.
- Write the main finding in one sentence.
The chart choice: ____________________________________________________________________
The chart title: ____________________________________________________________________
The finding in plain language: ____________________________________________________________________
Pause and check
Activity 10: Summarise with a PivotTable
Outcome: Create a flexible summary from one structured dataset and check the calculation used in Values.
- Select a cell inside the Excel table.
- Insert a PivotTable using the table as the source.
- Place the comparison category in Rows or Columns.
- Place the measure in Values.
- Confirm whether Values uses Sum, Count, Average or another calculation.
- Add a filter only where it helps answer the question.
- Rearrange one field to answer a second question without changing the source.
- Refresh the PivotTable after adding or changing a practice source row.
| PivotTable decision | Your choice |
|---|---|
| source table | |
| row or column category | |
| measure in Values | |
| summary calculation | |
| optional filter | |
| finding |
Pause and check
Activity 11: Plan repeatable data preparation
Outcome: Recognise when Power Query is more suitable than repeatedly copying and cleaning data by hand.
- Identify a prepared source that is imported repeatedly.
- List one unwanted column or repeated cleaning step.
- Identify a data type that needs correcting.
- Open Power Query only where it is available and you are authorised to connect to the source.
- Apply a safe practice cleaning step.
- Rename the query so its purpose is recognisable.
- Load the result to an appropriate worksheet.
- Refresh and check the output against the source.
| Repeatable step | Your plan |
|---|---|
| source | |
| unwanted column or row | |
| data type correction | |
| query name | |
| refresh check |
Notice: Use Power Query where cleaning or combining steps should be repeatable. Keep the original source and review the refreshed result rather than assuming the transformation remains correct.
Pause and check
Put it into practice: structure, calculate, summarise and explain
Scenario
A service team has a worksheet of requests with dates, categories, status and handling time. The team needs to understand which category has the most open requests and present one dependable finding.
- write the plain-language question and intended decision
- give the source sheet a clear purpose
- check headings, dates, categories, status and values
- convert the records into an Excel table
- filter open requests and then return to the full dataset
- choose a formula or PivotTable that answers the question
- sense-check the result against visible records
- use conditional formatting or a chart only if it improves understanding
- state the finding, scope and any important limitation in plain language
- record the route back to the source and refresh method
The question: ____________________________________________________________________
The feature chosen: ____________________________________________________________________
The finding: ____________________________________________________________________
The scope or limitation: ____________________________________________________________________
The refresh and return route: ____________________________________________________________________
Quick reference: choose the Excel tool
| If you need to… | Try… |
|---|---|
| create a reusable structured range | Excel table |
| inspect categories, statuses or periods | Sort and Filter |
| produce a defined calculation | a formula |
| show records meeting a visible rule | conditional formatting with a value or label |
| compare categories or show a trend | a clear chart |
| create a flexible summary | PivotTable |
| repeat cleaning or combining steps | Power Query |
| check whether the answer is dependable | inspect references, filters, values and visible records |
Your three takeaways
My most useful learning: ____________________________________________________________________
What I will implement: ____________________________________________________________________
What I will explore further: ____________________________________________________________________
If you need help
- describe whether you were using Excel on the web or the desktop application
- name the worksheet, table, formula, chart, PivotTable or query involved
- note the exact wording of any error or unexpected result
- keep a separate copy of important work before practising substantial changes
- ask your local support route about data connections, permissions or unavailable features
- avoid sharing screenshots containing personal, confidential or sensitive information
Confidence grows through a repeatable data journey: define the question, structure reliable records, choose the lightest useful feature and explain the checked finding plainly.
Reflective journal
Why we ask you to reflect
Continuing Professional Development (CPD) is formative and it is about what it achieves for you and your organisation.
Instead of formally assessing your learning, we ask you to write a reflective note. This should reflect on how the learning was relevant and how it will impact your working practices.
Taking time to reflect on your learning makes it more likely you will embed it in your future practice.
What to cover and when
What your reflection should cover
- how the learning was relevant to you
- how the learning will impact your practice
When to complete it
Reflect as soon as possible following the skilling session. This keeps your note contemporaneous (written close to the time) and meaningful. Fill it in on your device, so the boxes expand as you type.
| Topic | What to know |
|---|---|
| Timing | Complete the note as soon as possible after the training event. |
| Purpose | To embed the learning within your subsequent practice. |
| Focus | How the learning was relevant and how it will impact your practice. |
Your reflective note
Complete each row below. Write in your own words. Your notes are private to you unless you choose to share them.
| Prompt | Your response |
|---|---|
| Skilling session title | |
| Date of the skilling session | |
| Date you completed this note | |
| How was the learning relevant to you and your work? | |
| How will the learning impact your practice? |
Recommended resources
These curated resources accompany the WeChange.AI skilling offer of Continuing Professional Development (CPD) accredited, and non-accredited, sessions. Use them before a session to build familiarity, or afterwards to revisit and apply the learning in day-to-day work.
Alongside these resources, Navigator helps WeChange.AI customers find personalised recommendations and available learning on Microsoft 365 tools, accessibility and AI relevant to their role. Returning to Navigator after a session can help you connect new knowledge with practical workplace needs, choose a useful next step and keep learning visible as confidence grows.
The Excel support hub, with tutorials and guidance. A useful bookmark for looking up a feature after the session.
Explains table features such as header rows, banded rows, calculated columns and total rows, and how to create one with Format as Table. A tidy structure makes later steps, such as charts and PivotTables, simpler.
Explains how rules change the look of cells based on their values. Add labels or text as well, so meaning does not depend on colour alone.
Walks through selecting data, choosing a recommended chart and adding a trendline. A good starting point for presenting data clearly.
Explains how to insert a PivotTable from a table or range and add fields to rows, columns and values. It also shows how to refresh a PivotTable when your data changes.
Describes exploring a worksheet using natural language. It helps you spot patterns without building every calculation yourself.
Introduces Power Query, aimed at more experienced users who re-key or combine data from different sources. Worth exploring once you are comfortable with tables and formulas.